
MAVERICK INDUSTRIAL GROUP

DATA ANALYTICS

Industrial Data Analytics & Continuous Improvement

Most industrial operations collect significant amounts of data but have difficulty turning it into actionable information. Maintenance records, ERP data, work orders, inspection results, production records, project information, and field data can live in separate systems, making recurring problems and performance trends difficult to see.

Maverick Industrial Group combines practical industrial experience, data analytics, and Lean Six Sigma methodology to help organizations identify opportunities to reduce downtime, eliminate waste, control costs, and improve operational performance. Our focus is on analyzing and visualizing the data the organization already collects.

Business team reviewing performance reports around a table

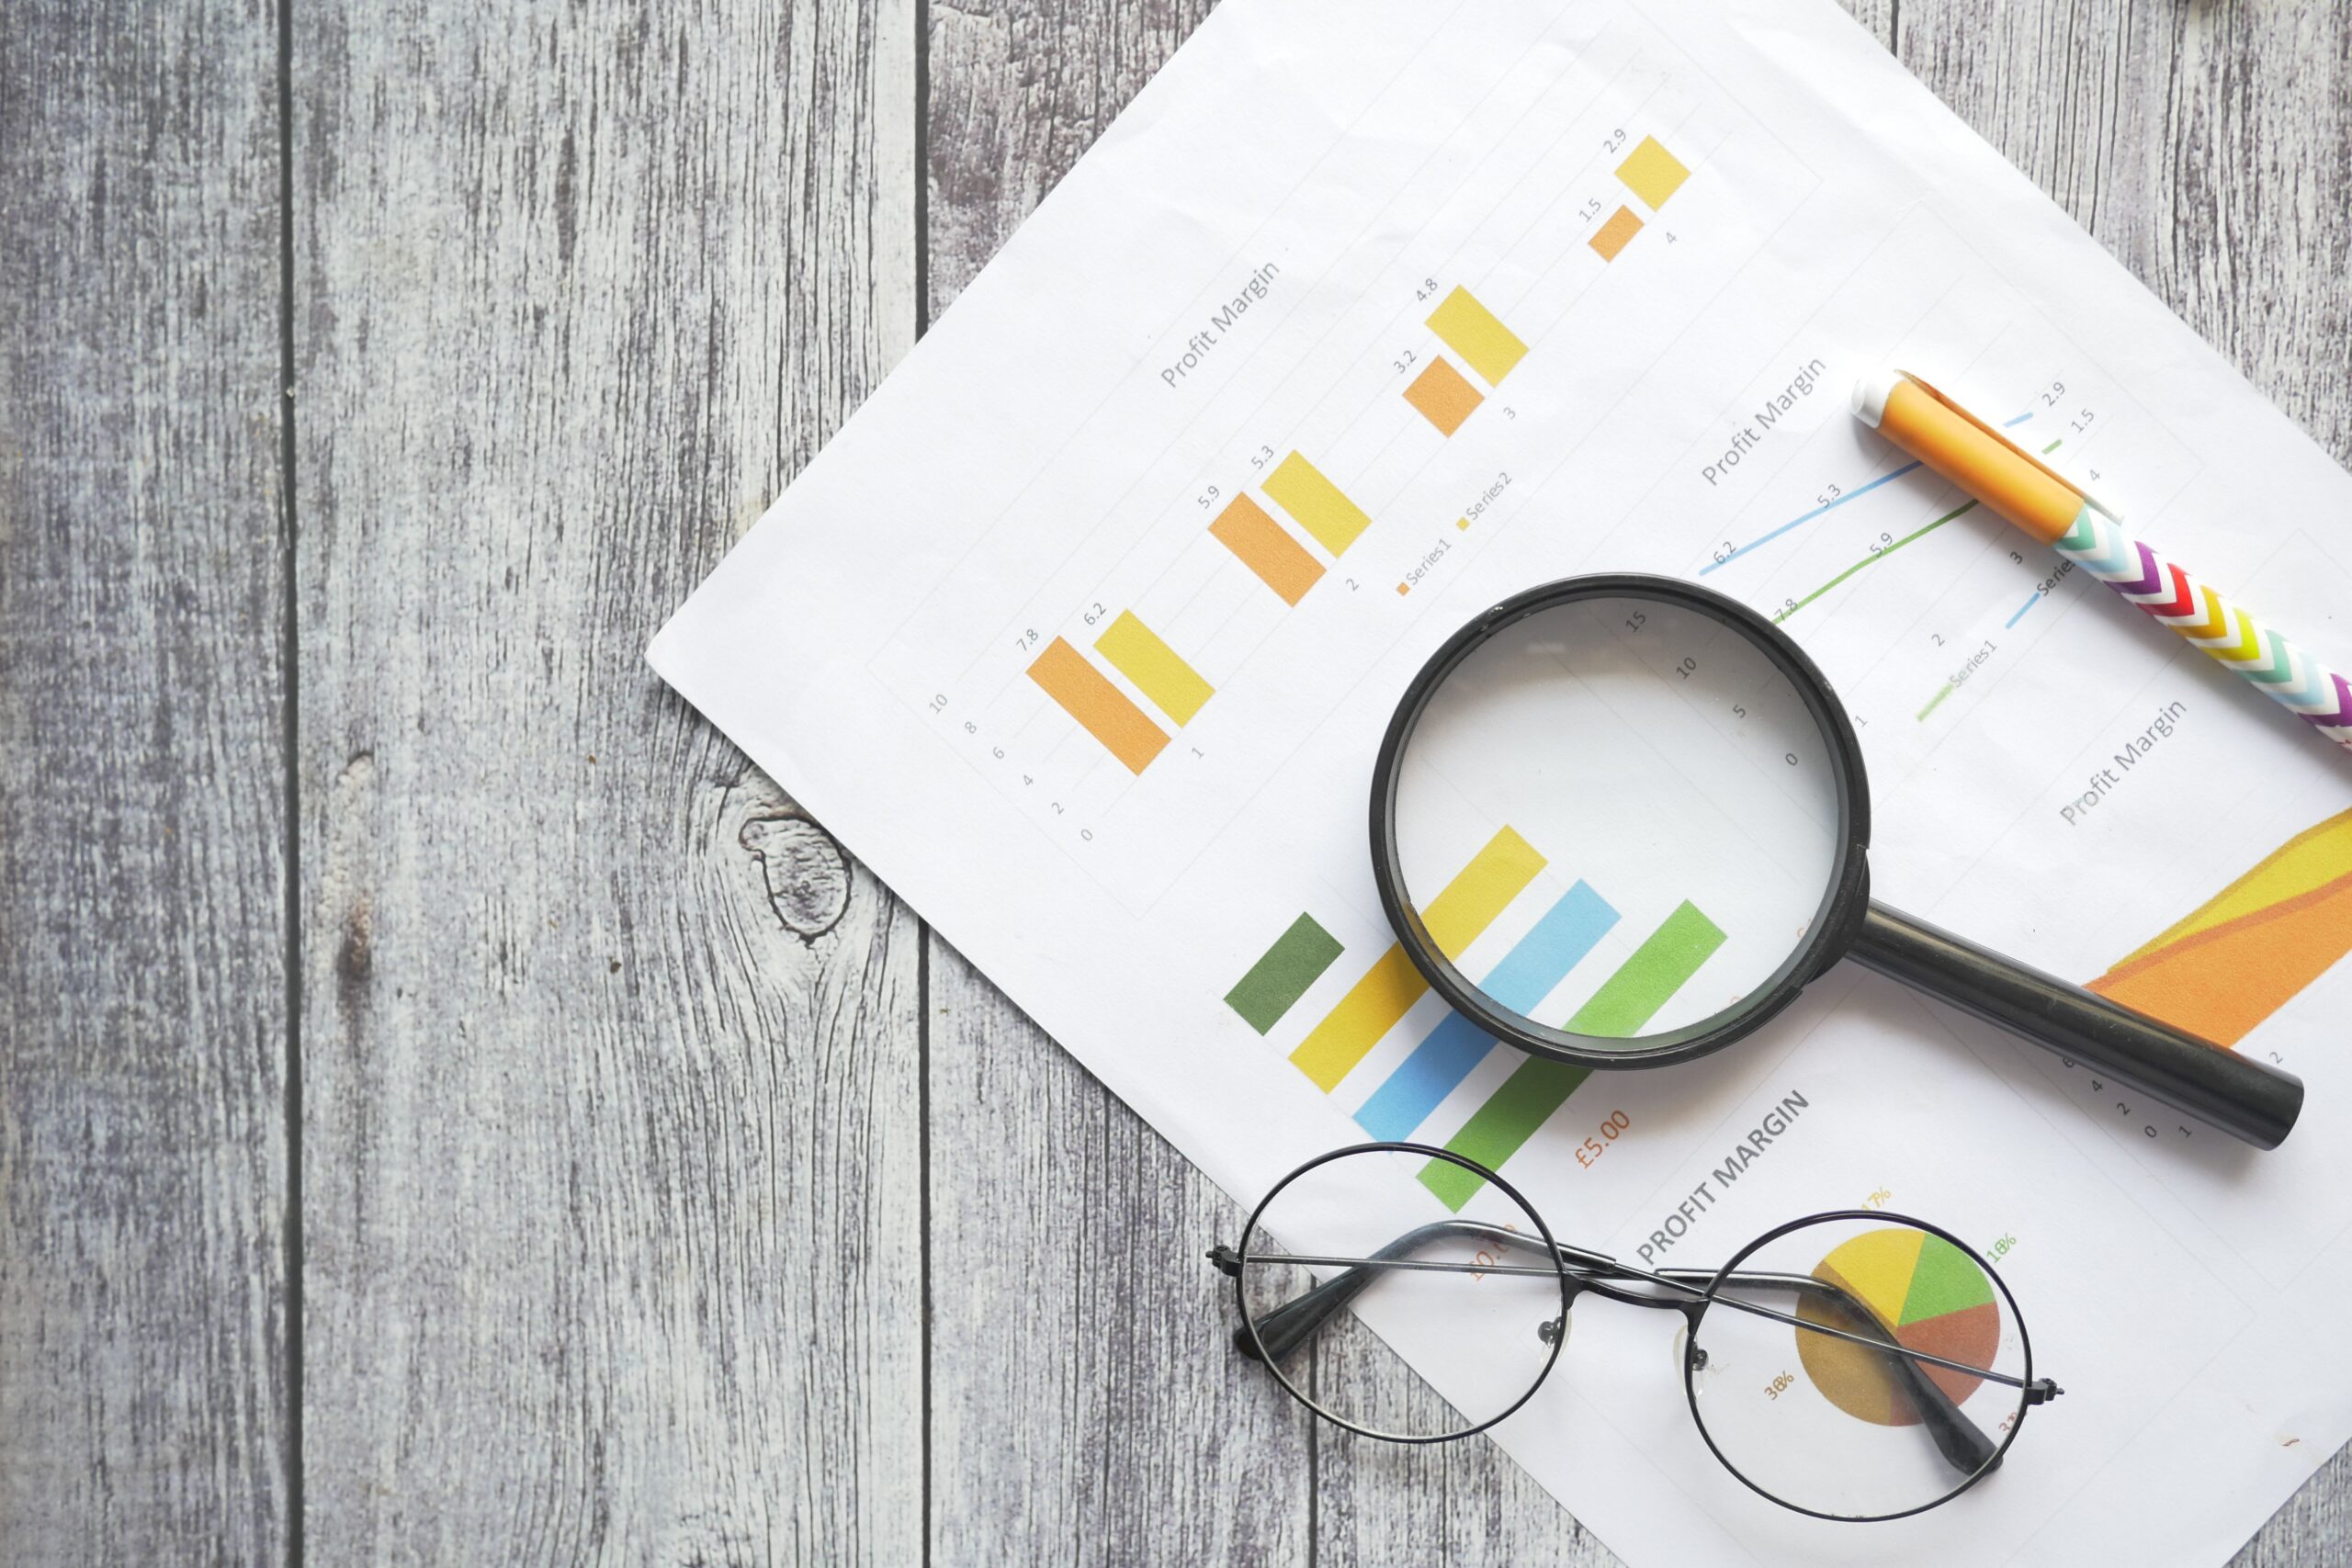
Power BISee Performance

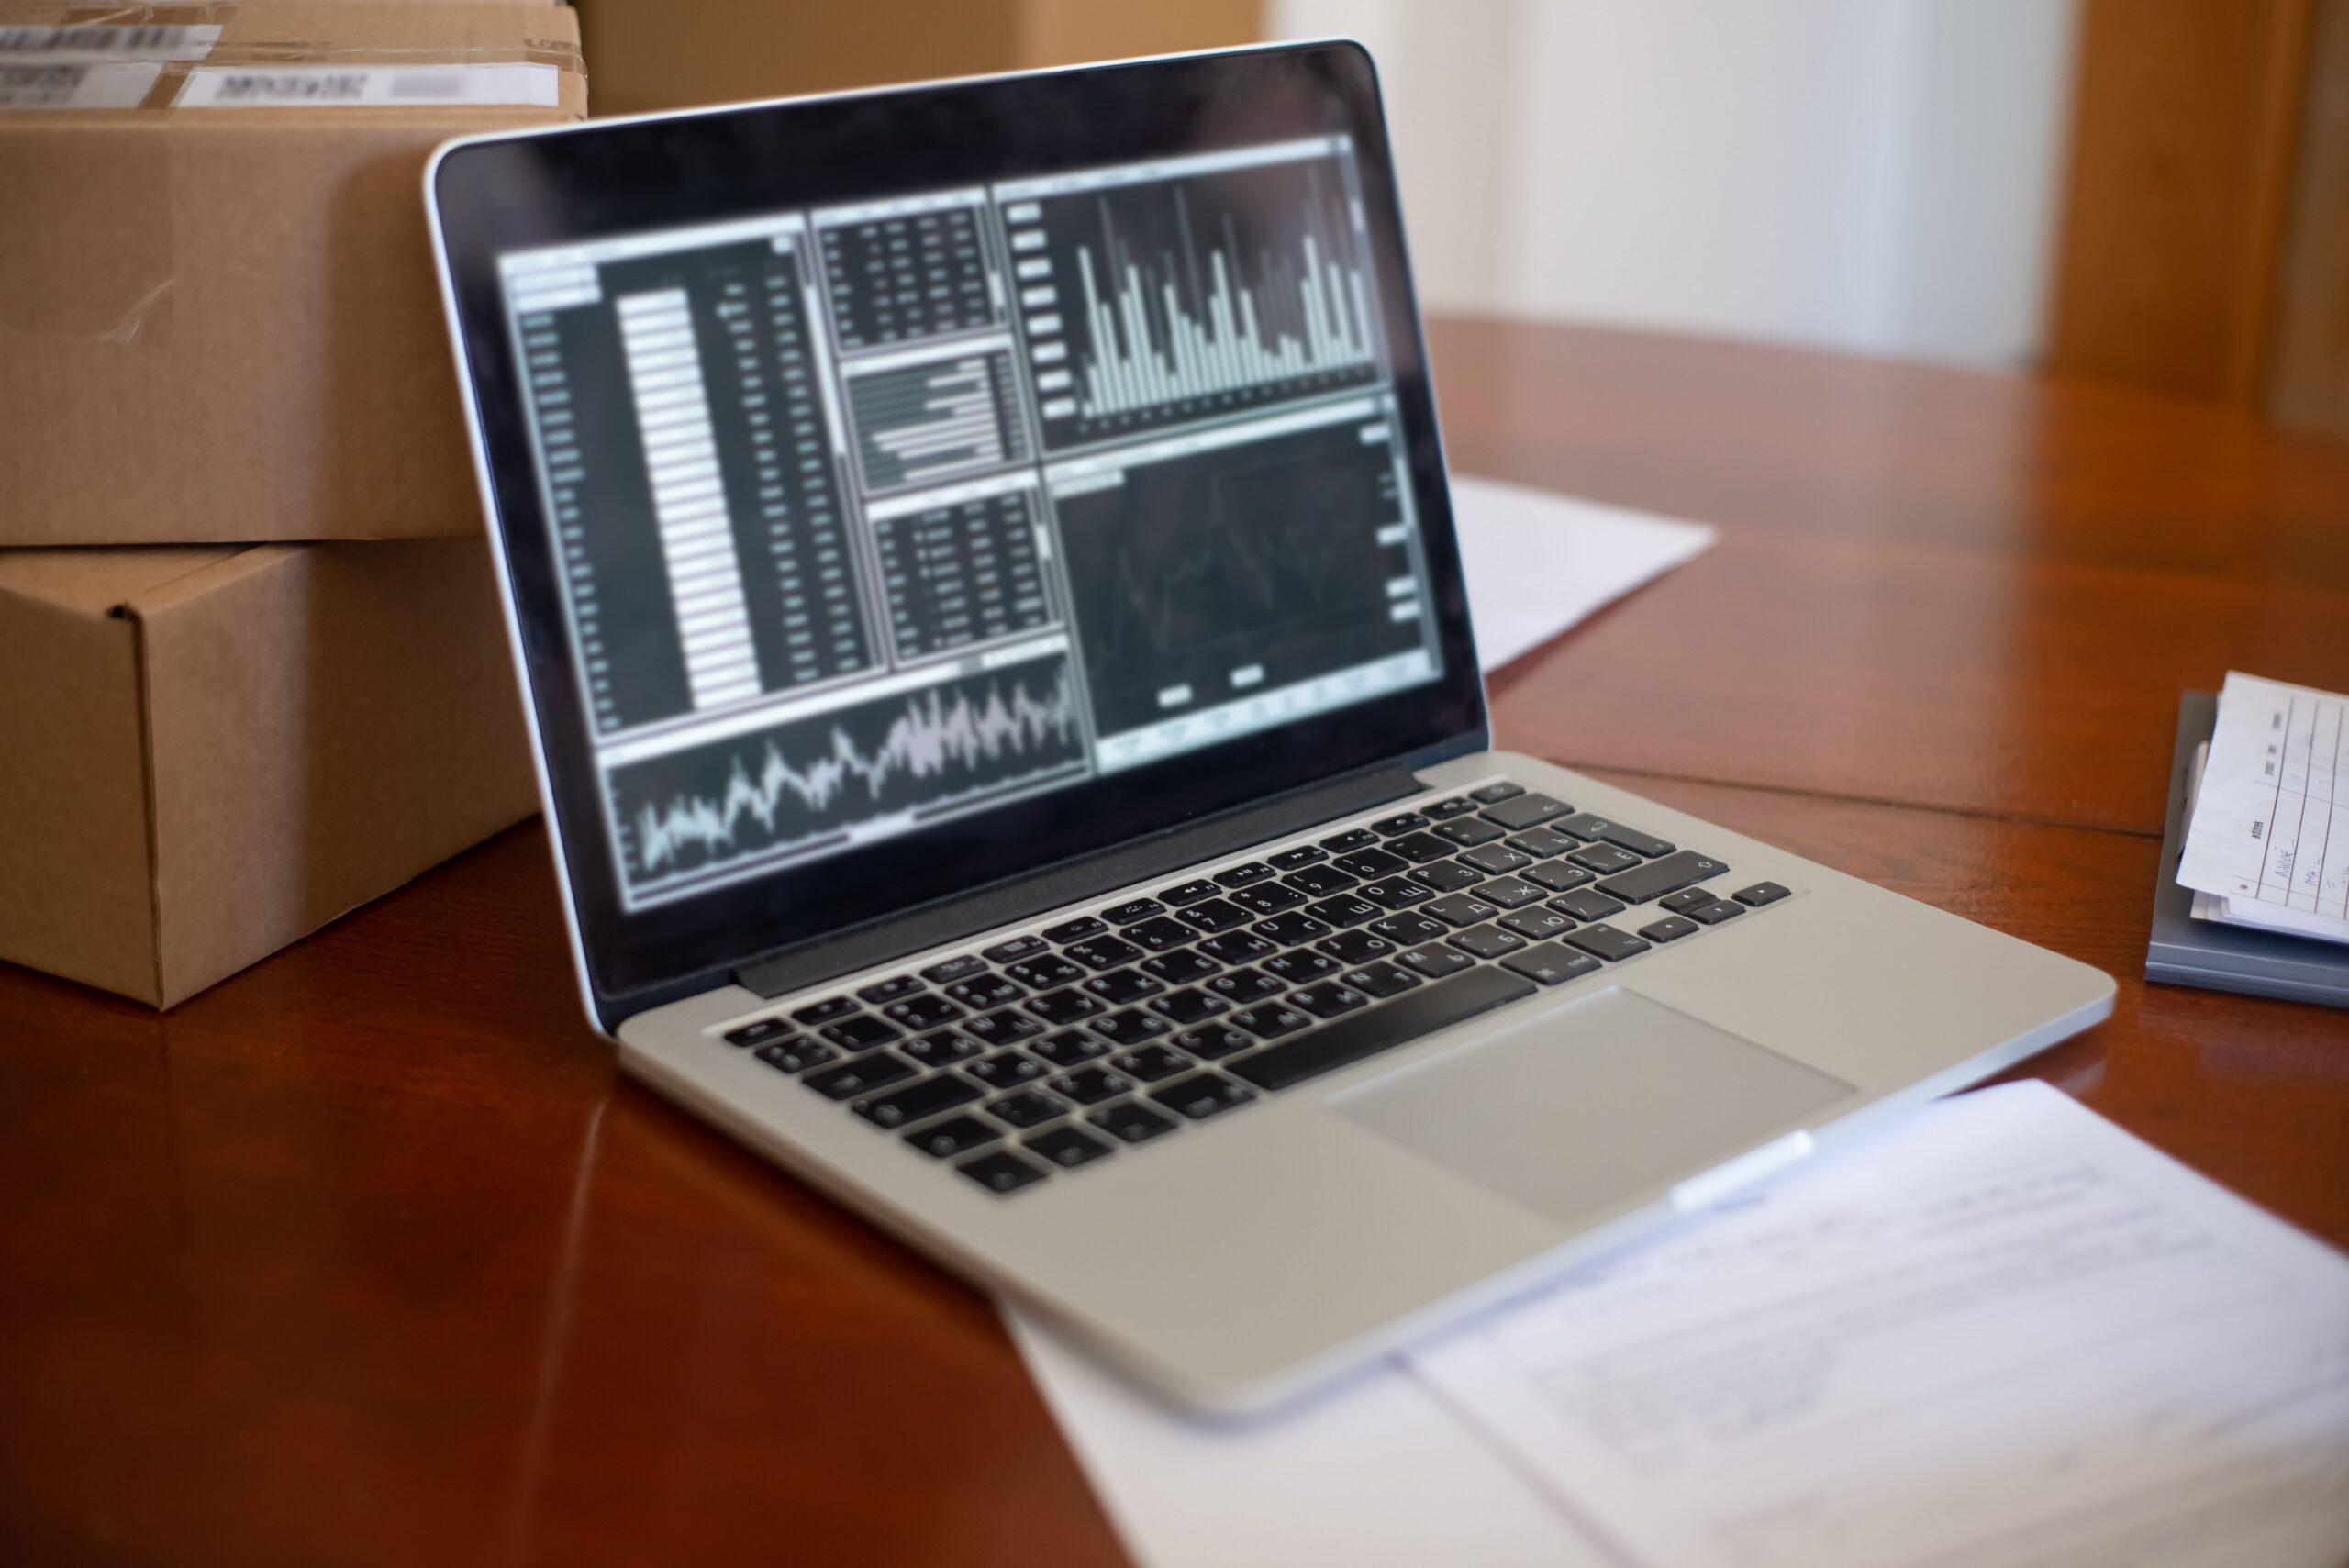
Develop dashboards, KPI tracking, trend analysis, cost and schedule reporting, maintenance metrics, and management-level visualizations that make performance easier to understand.
Two site workers in hard hats reviewing a plan on a tablet

ArcGISSee Where It's Happening

Use maps and geographic analysis to understand where issues occur across facilities, sites, assets, projects, and service territories. Combining operational and geographic data can reveal patterns that traditional reports may miss.
Team seated around a boardroom table during a presentation

Lean Six SigmaUnderstand Why

Use structured improvement methods, including DMAIC where appropriate, to define problems, measure performance, analyze contributing factors, identify improvement opportunities, and create practical controls.

Engagements and Deliverables

TypicalEngagements

Operational Assessment

Focused DMAIC Improvement Project

Dashboard / KPI Development

Project or Asset Performance Reporting

Geographic / Asset Analysis

Ongoing Continuous Improvement Partnership

PotentialDeliverables

  • Power BI dashboards
  • KPI frameworks and performance metrics
  • Trend and process analysis
  • ArcGIS maps and geographic analysis
  • Improvement recommendations
  • Control plans and ongoing reporting tools
Engagements and Deliverables

PotentialDeliverables

  • Power BI dashboards
  • KPI frameworks and performance metrics
  • Trend and process analysis
  • ArcGIS maps and geographic analysis
  • Improvement recommendations
  • Control plans and ongoing reporting tools
Scroll to Top